Reproduction of Color Part 2: Human Vision System
I prepared this material to be delivered in spoken form to a mixed audience of game developers. Accessibility is prioritized over precision.
- Part 1: Physics of Light
- Part 2: Human Vision System (You are here)
- Part 3: Colorimetry
- Part 4: TODO
A comprehensive study of the human vision system is daunting. It touches on many fields of study: optics, biochemistry, and psychology, to just name a few. Many characteristics of the human vision system are difficult to isolate to any one part of the system. So I will focus on the parts that are better understood and most relevant to our discussion of the measurement and reproduction of color.
Structure of the Eye
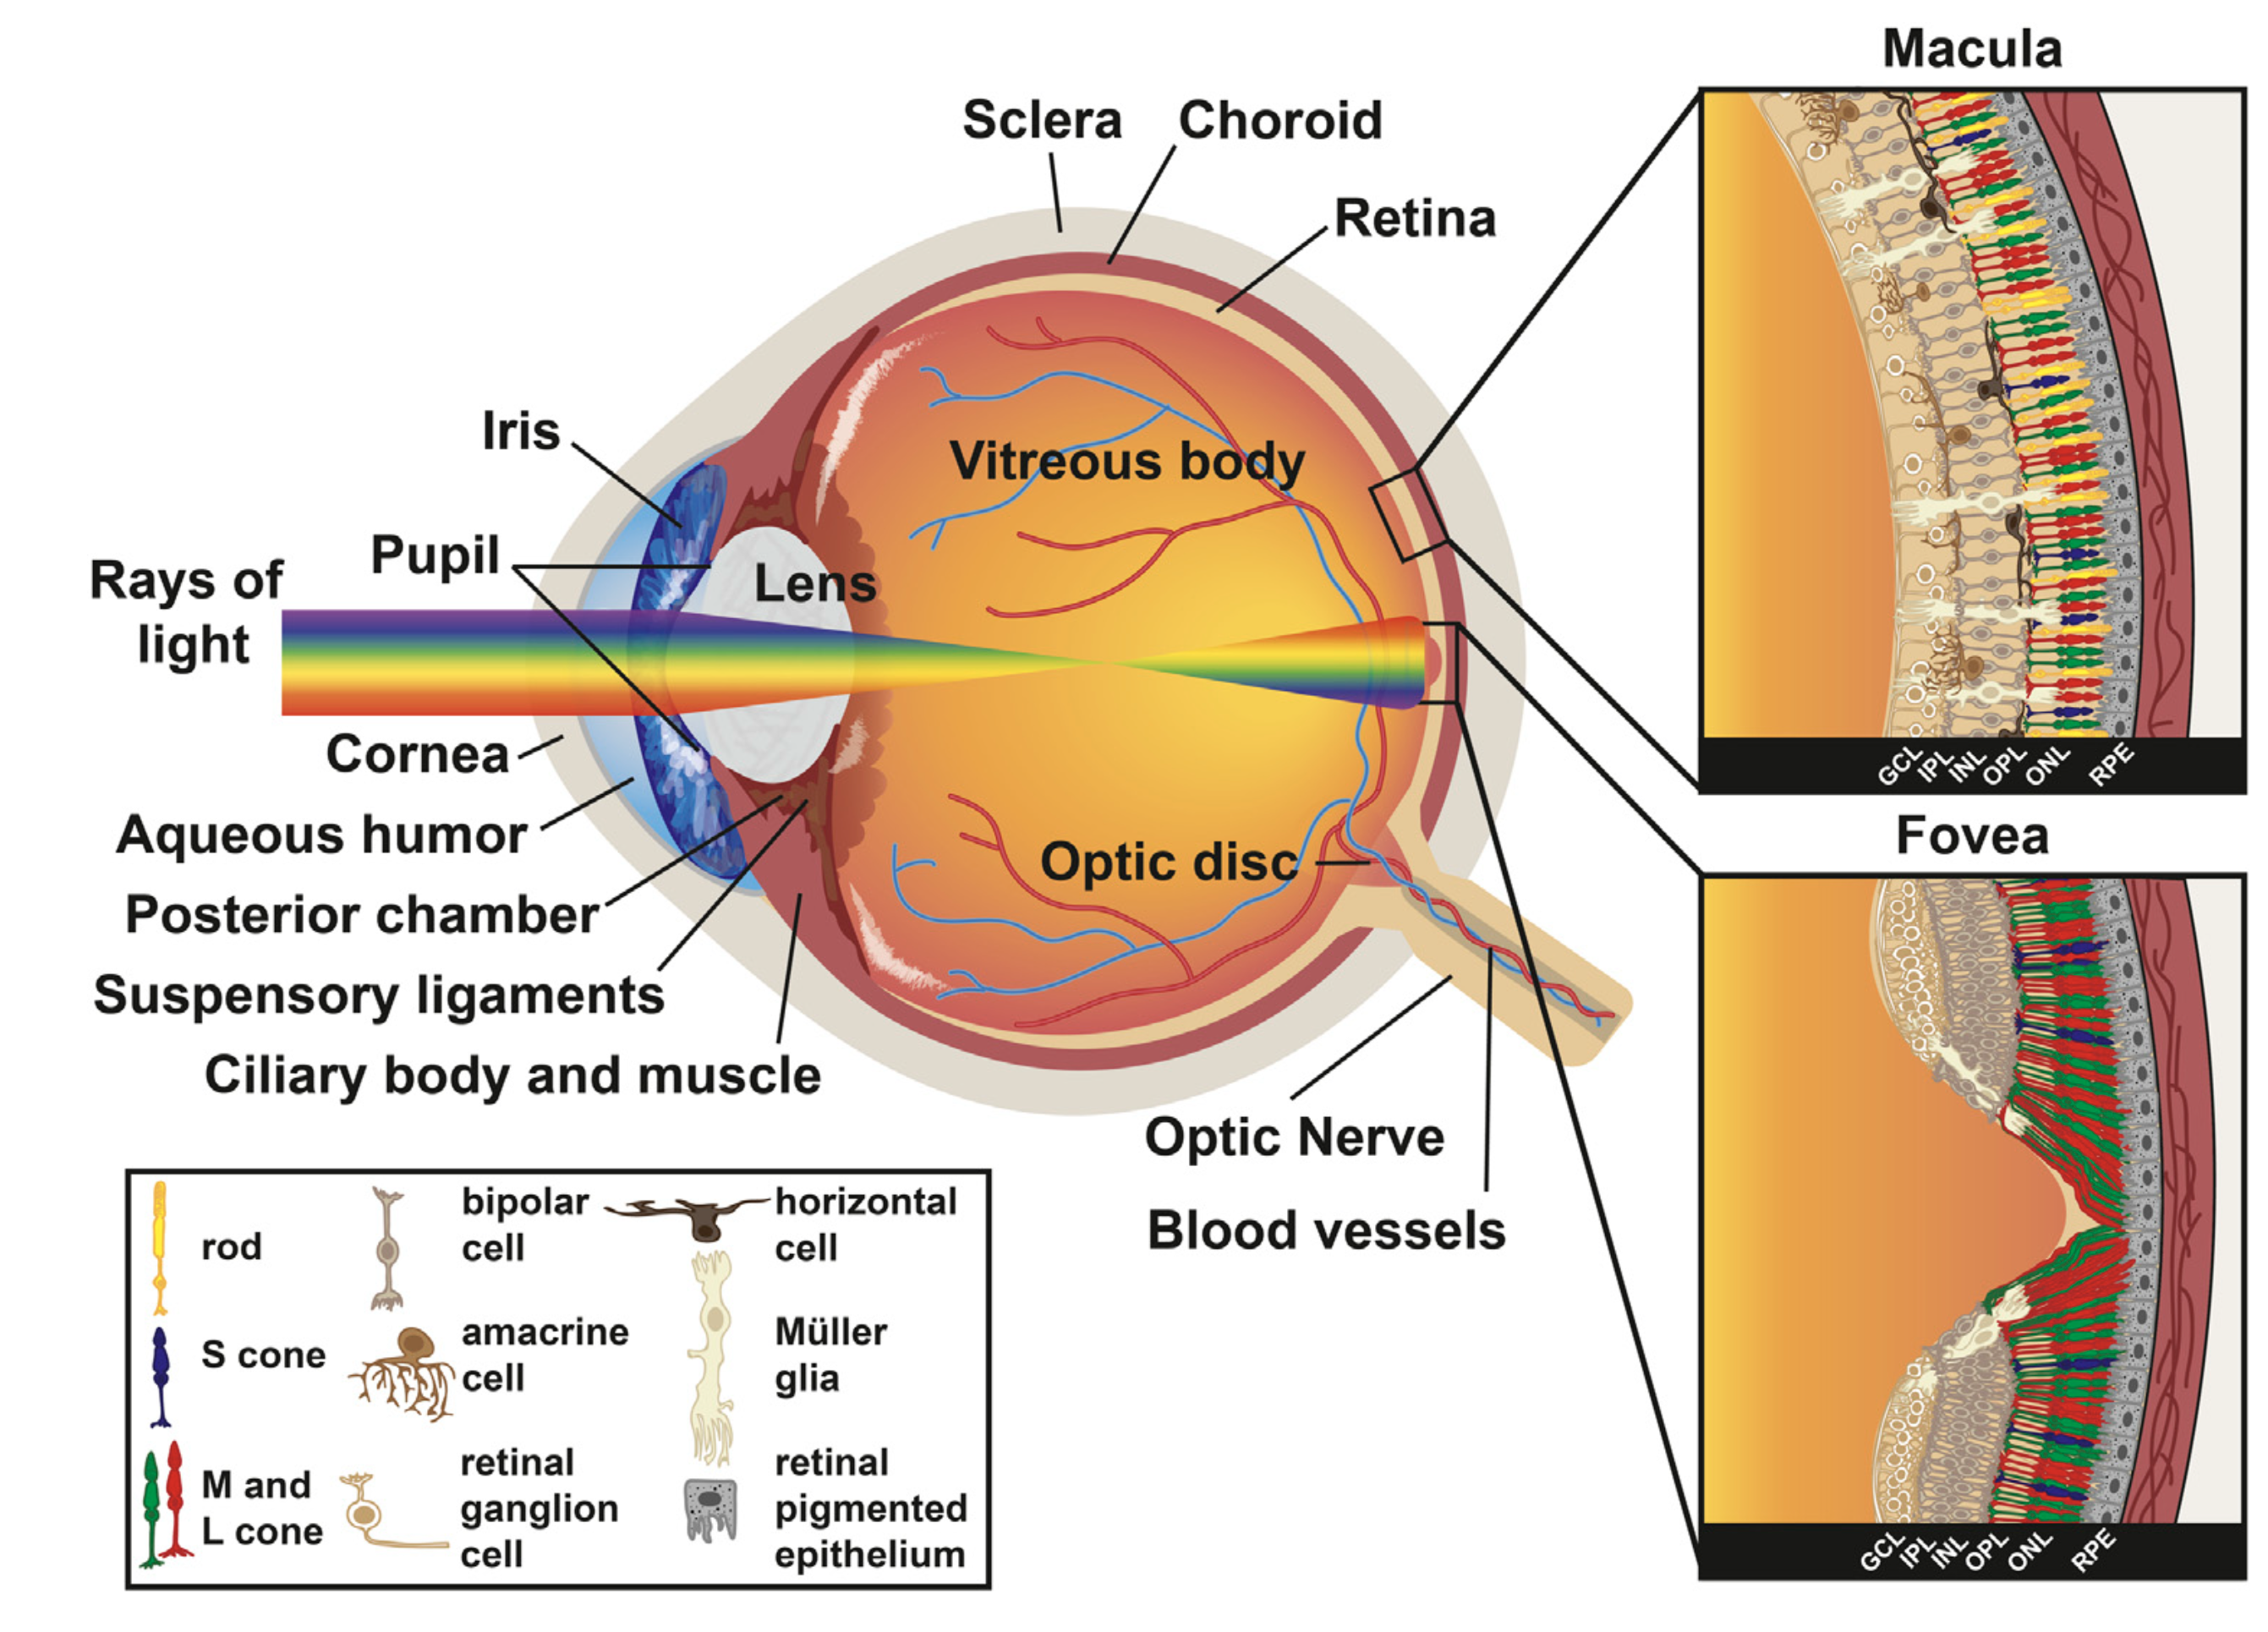
This is an image from the side of the eye. Light travels from a visible object to the retina. As light passes through the eye, an optical system focuses the image onto the retina.
The lens in the eye yellows with age. This causes more blue light to be absorbed, reducing perception of violet and blue light. While aspects of the human vision system adapt to this, evidence of it appears in color vision tests. This change in color perception over age is subtle enough that it isn’t actively noticed by the observer.
Hussey, K. A., Hadyniak, S. E., Johnston, R. J. (2022) Patterning and Development of Photoreceptors in the Human Retina. Frontiers in Cell and Developmental Biology. Volume 10 - 2022. https://www.frontiersin.org/journals/cell-and-developmental-biology/articles/10.3389/fcell.2022.878350/full. (CC BY)
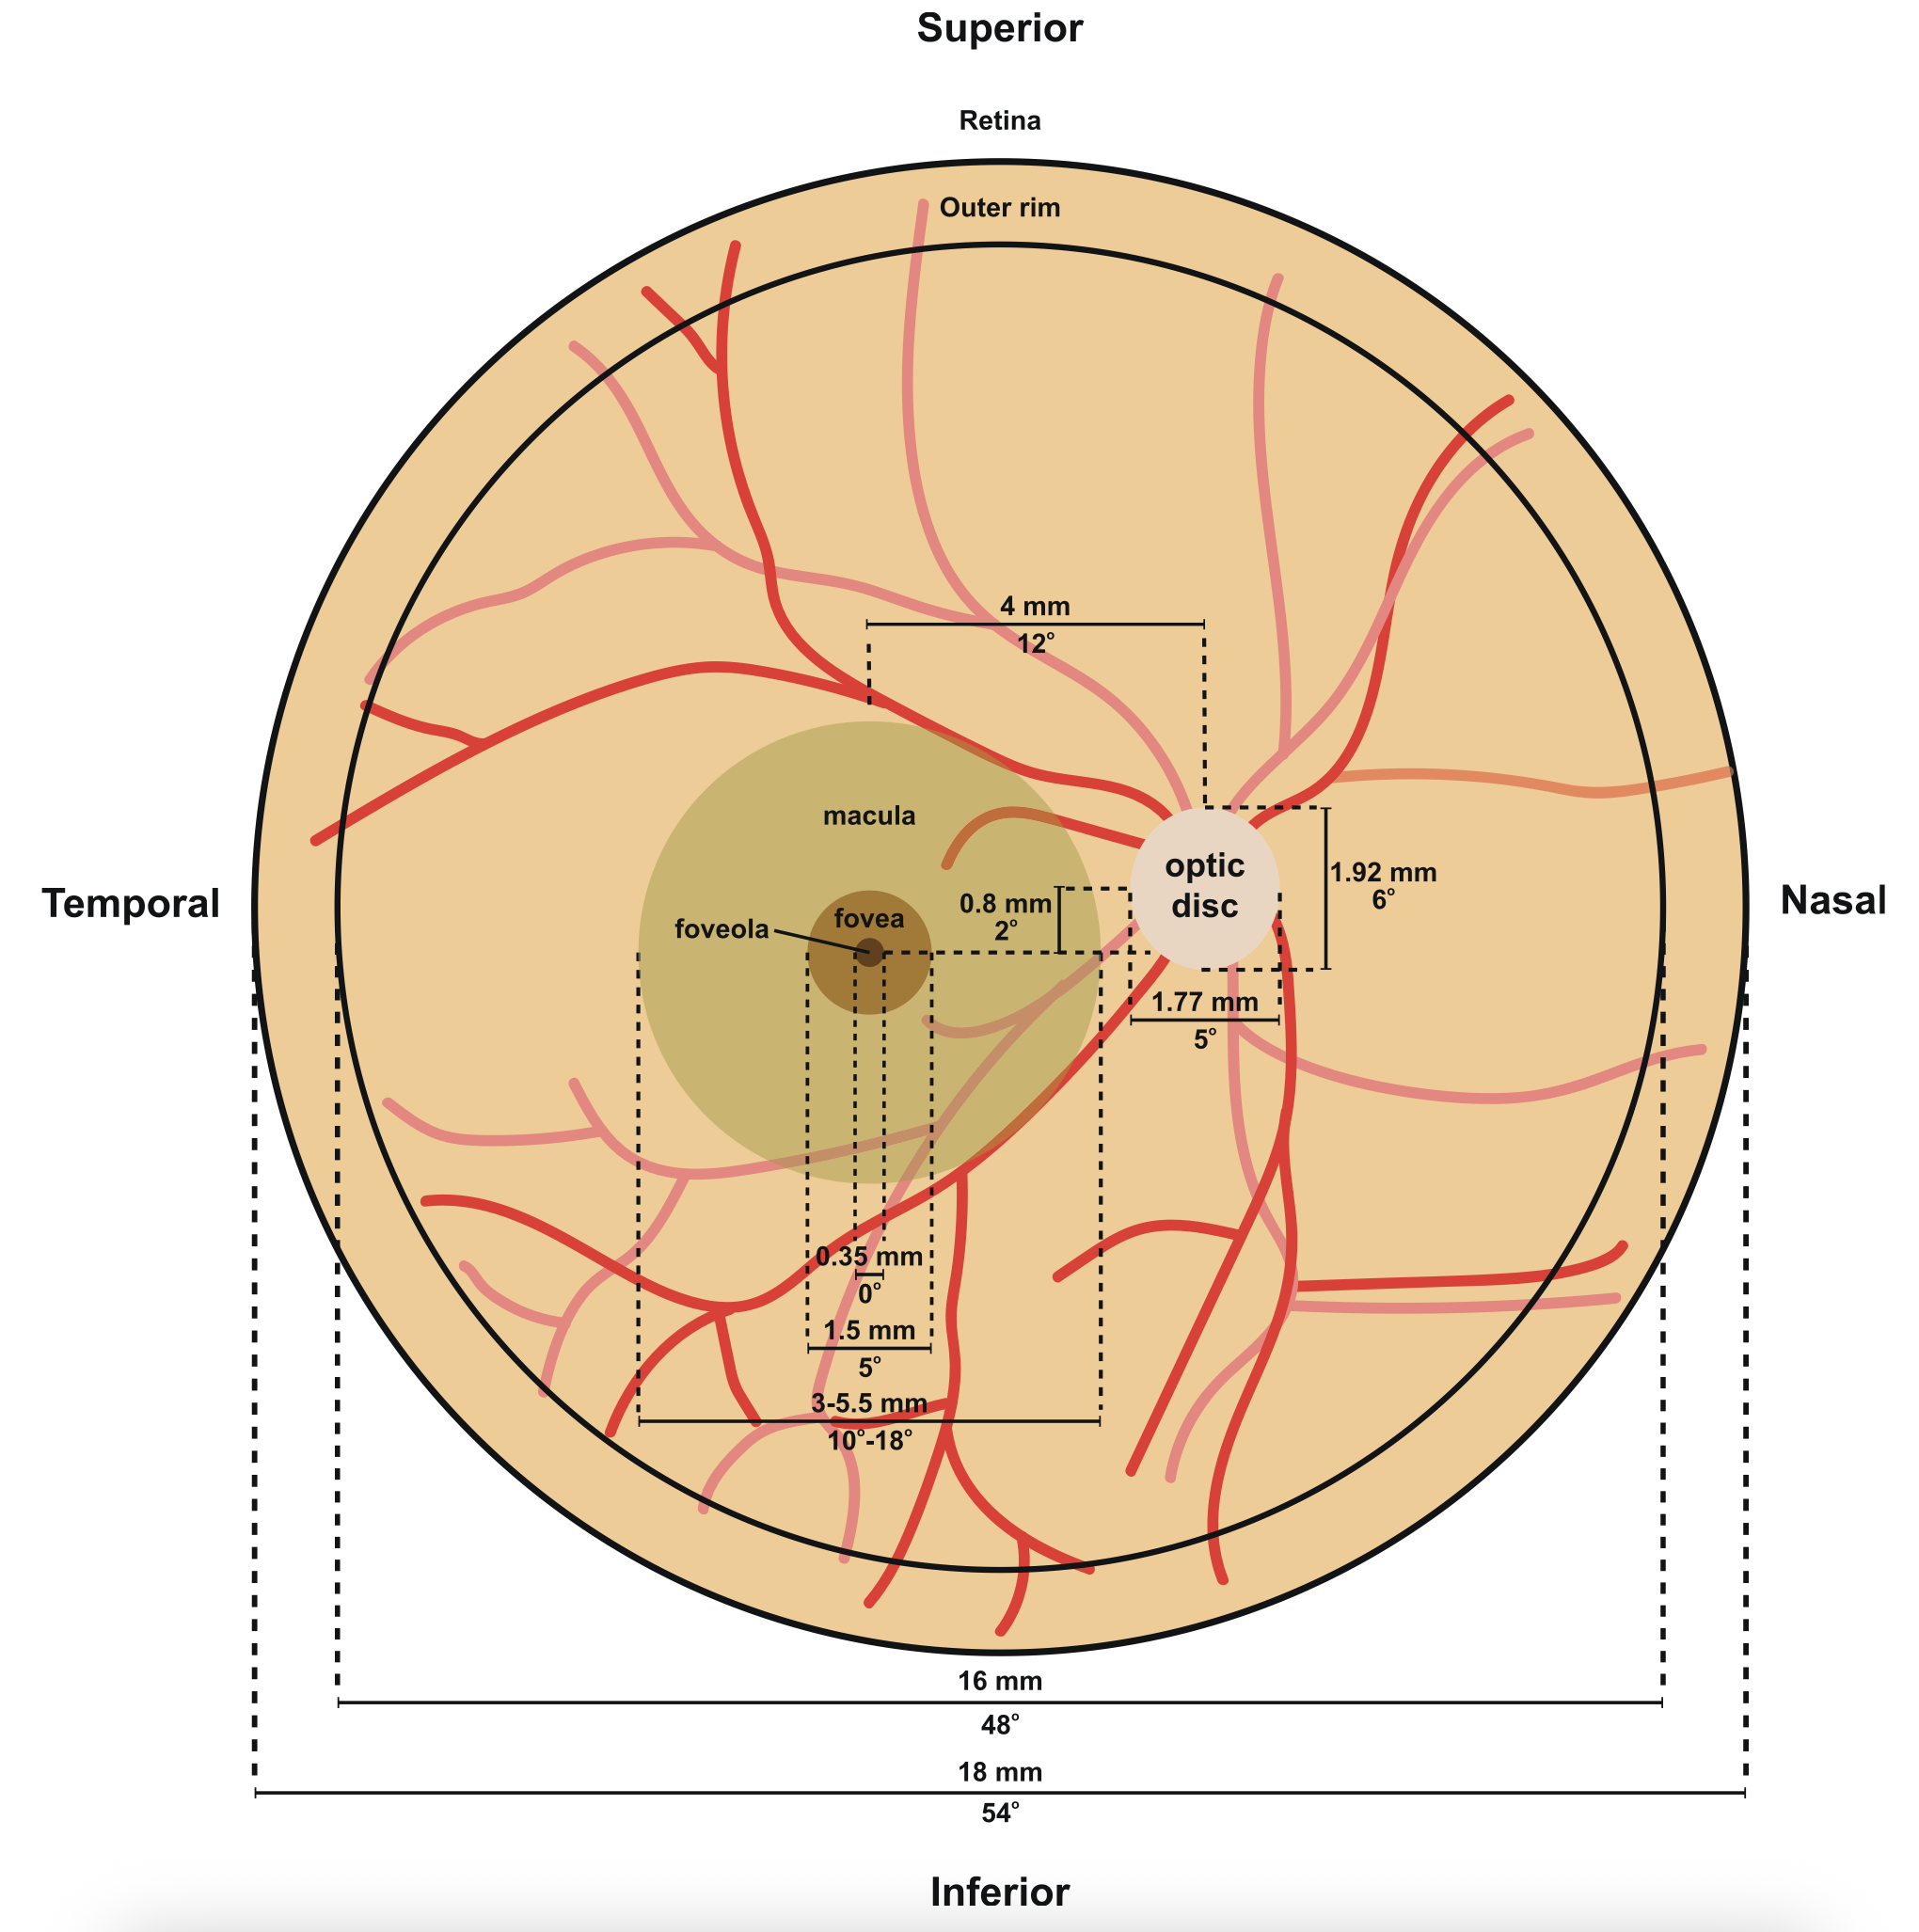
Here is a diagram from the back of the eye, facing forward. When you center an object in your view, the light that travels from that object to your retina will be hitting the fovea and foveola. In other words, the fovea and foveola are approximately at the “center” of the photosensitive portion of the retina, and correspond to the “center” of our vision.
When you turn your eyes to center an object in view, the whole eyeball rotates, meaning the lens and retina are rotating together. The optic nerve has enough slack behind the eye to allow for the movement of the retina relative to the rest of the head.
Hussey, K. A., Hadyniak, S. E., Johnston, R. J. (2022) Patterning and Development of Photoreceptors in the Human Retina. Frontiers in Cell and Developmental Biology. Volume 10 - 2022. https://www.frontiersin.org/journals/cell-and-developmental-biology/articles/10.3389/fcell.2022.878350/full. (CC BY)
| Macula | Fovea |
|---|---|
 |
 |
Hussey, K. A., Hadyniak, S. E., Johnston, R. J. (2022) Patterning and Development of Photoreceptors in the Human Retina. Frontiers in Cell and Developmental Biology. Volume 10 - 2022. https://www.frontiersin.org/journals/cell-and-developmental-biology/articles/10.3389/fcell.2022.878350/full. (CC BY)
Here is a closer view of the insets labeled macula and fovea. What you are seeing here from left to right is a bunch of neural tissue, then the photosensitive cells of the retina, and finally the back of the retina. The photosensitive cells are behind the neural tissue, meaning the light has to pass through the neural tissue in order to hit a photosensitive cell.
The macula, shown on the left, handles central vision. The fovea, shown on the right, is the central part of the macula and handles the sharpest, most detailed “focal” area of your vision. You can see the shape of a pit in the fovea, where there is less neural tissue between the incoming light and the photosensitive cells. The word fovea is Latin for “pit.”
The photosensitive cells are called “rods” and “cones.” While rods only occur with a single pigment type, humans typically have cones with three different pigments. The pigments determine the range of wavelengths of light that the cell will be sensitive to.
The number of cone pigments varies from species to species. For example, chickens have 4 kinds of cone pigments. You may notice that the outer macula contains a wider variety of these cells than the fovea, which contains only cones. The very center of the fovea only contains two of the cone types. We will go into more depth on the distribution of rods and cones later.
Animals like cats, dogs, and deer have a highly reflective layer behind the retina. This is why animals can have “glowing” eyes. This photo was taken without a flash, and the glow was readily observable without a camera. This reflective layer means many photons will get a “second chance” to strike a photoreceptive cell. This is one reason why dogs and cats can see better than humans in low-light conditions, at the cost of some clarity in the perceived image.

Chromatic Aberration
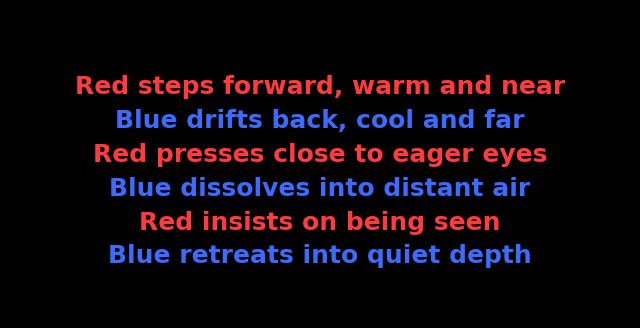
As we previously discussed, most light is a combination of photons of many different wavelengths. Red and blue wavelengths will refract slightly differently as they travel through the optics of the eye. Chromatic aberration is the inability of a lens to focus all wavelengths of light at the same point. This can lead to the perception of depth separation of red and blue colors.
Most people will perceive that the red text is advancing and the blue text is receding. However, some people will perceive the opposite, and some won’t perceive a difference in depth at all.
While this depth separation could be used intentionally in an artistic way, the intensity varies from person to person, can be reversed, and some people will not experience it at all.
As an aside, the popular teal-and-orange color grading look might benefit from this physical effect to enhance depth separation, but it’s difficult to pick apart the physical effect from potential perceptual and psychological effects.
Cones
In light-adjusted states, human vision relies mostly on cones. Cones contain pigments that chemically change when hit with a photon. Each cone type is sensitive to a distribution of wavelengths, not a single exact wavelength.
We frequently work with three color channels that correspond to red, green, and blue. Since humans typically have three kinds of cones, it’s tempting to think of them as independent detectors of “red,” “green,” and “blue.” This is incorrect! Cones are sensitive to broad, overlapping ranges of wavelengths.
To reduce confusion, we’ll call them L, M, and S—for long, medium, and short wavelength-sensitive cones.
The sensitivity distributions of these cone types overlap significantly, and this has major implications:
- Your perception of “green” doesn’t come just from the M cone, but from comparing the relative signal strength from all three cone types.
- The peak sensitivities for L and M cones are quite close together—closer to yellow-green and green wavelengths. The L cone’s peak is actually in the yellow-green range, nowhere near red.
- Different wavelengths produce different ratios of L and M cone responses. For example, when the L cone responds much more strongly than the M cone, you perceive red, even though the L cone’s peak sensitivity is in the yellow-green range.

Rods
Rods are far more sensitive than cones. They generally follow the same chemical process that cones do, but there is only one type of rod.
Rods alone offer no ability to perceive color. Under dim lighting conditions, such that cones are not receiving enough photons to meaningfully activate, human vision switches predominantly to using rods. So perception of color decreases under low-light scenarios.
Compared to the combined sensitivity of cones, rods are relatively more sensitive to blue-green wavelengths. While rods do not on their own provide color perception, they can affect color perception in low light conditions as the eye transitions between dark-adjusted and light-adjusted states. This is known as the “Purkinje effect.”

Distribution of Rods and Cones
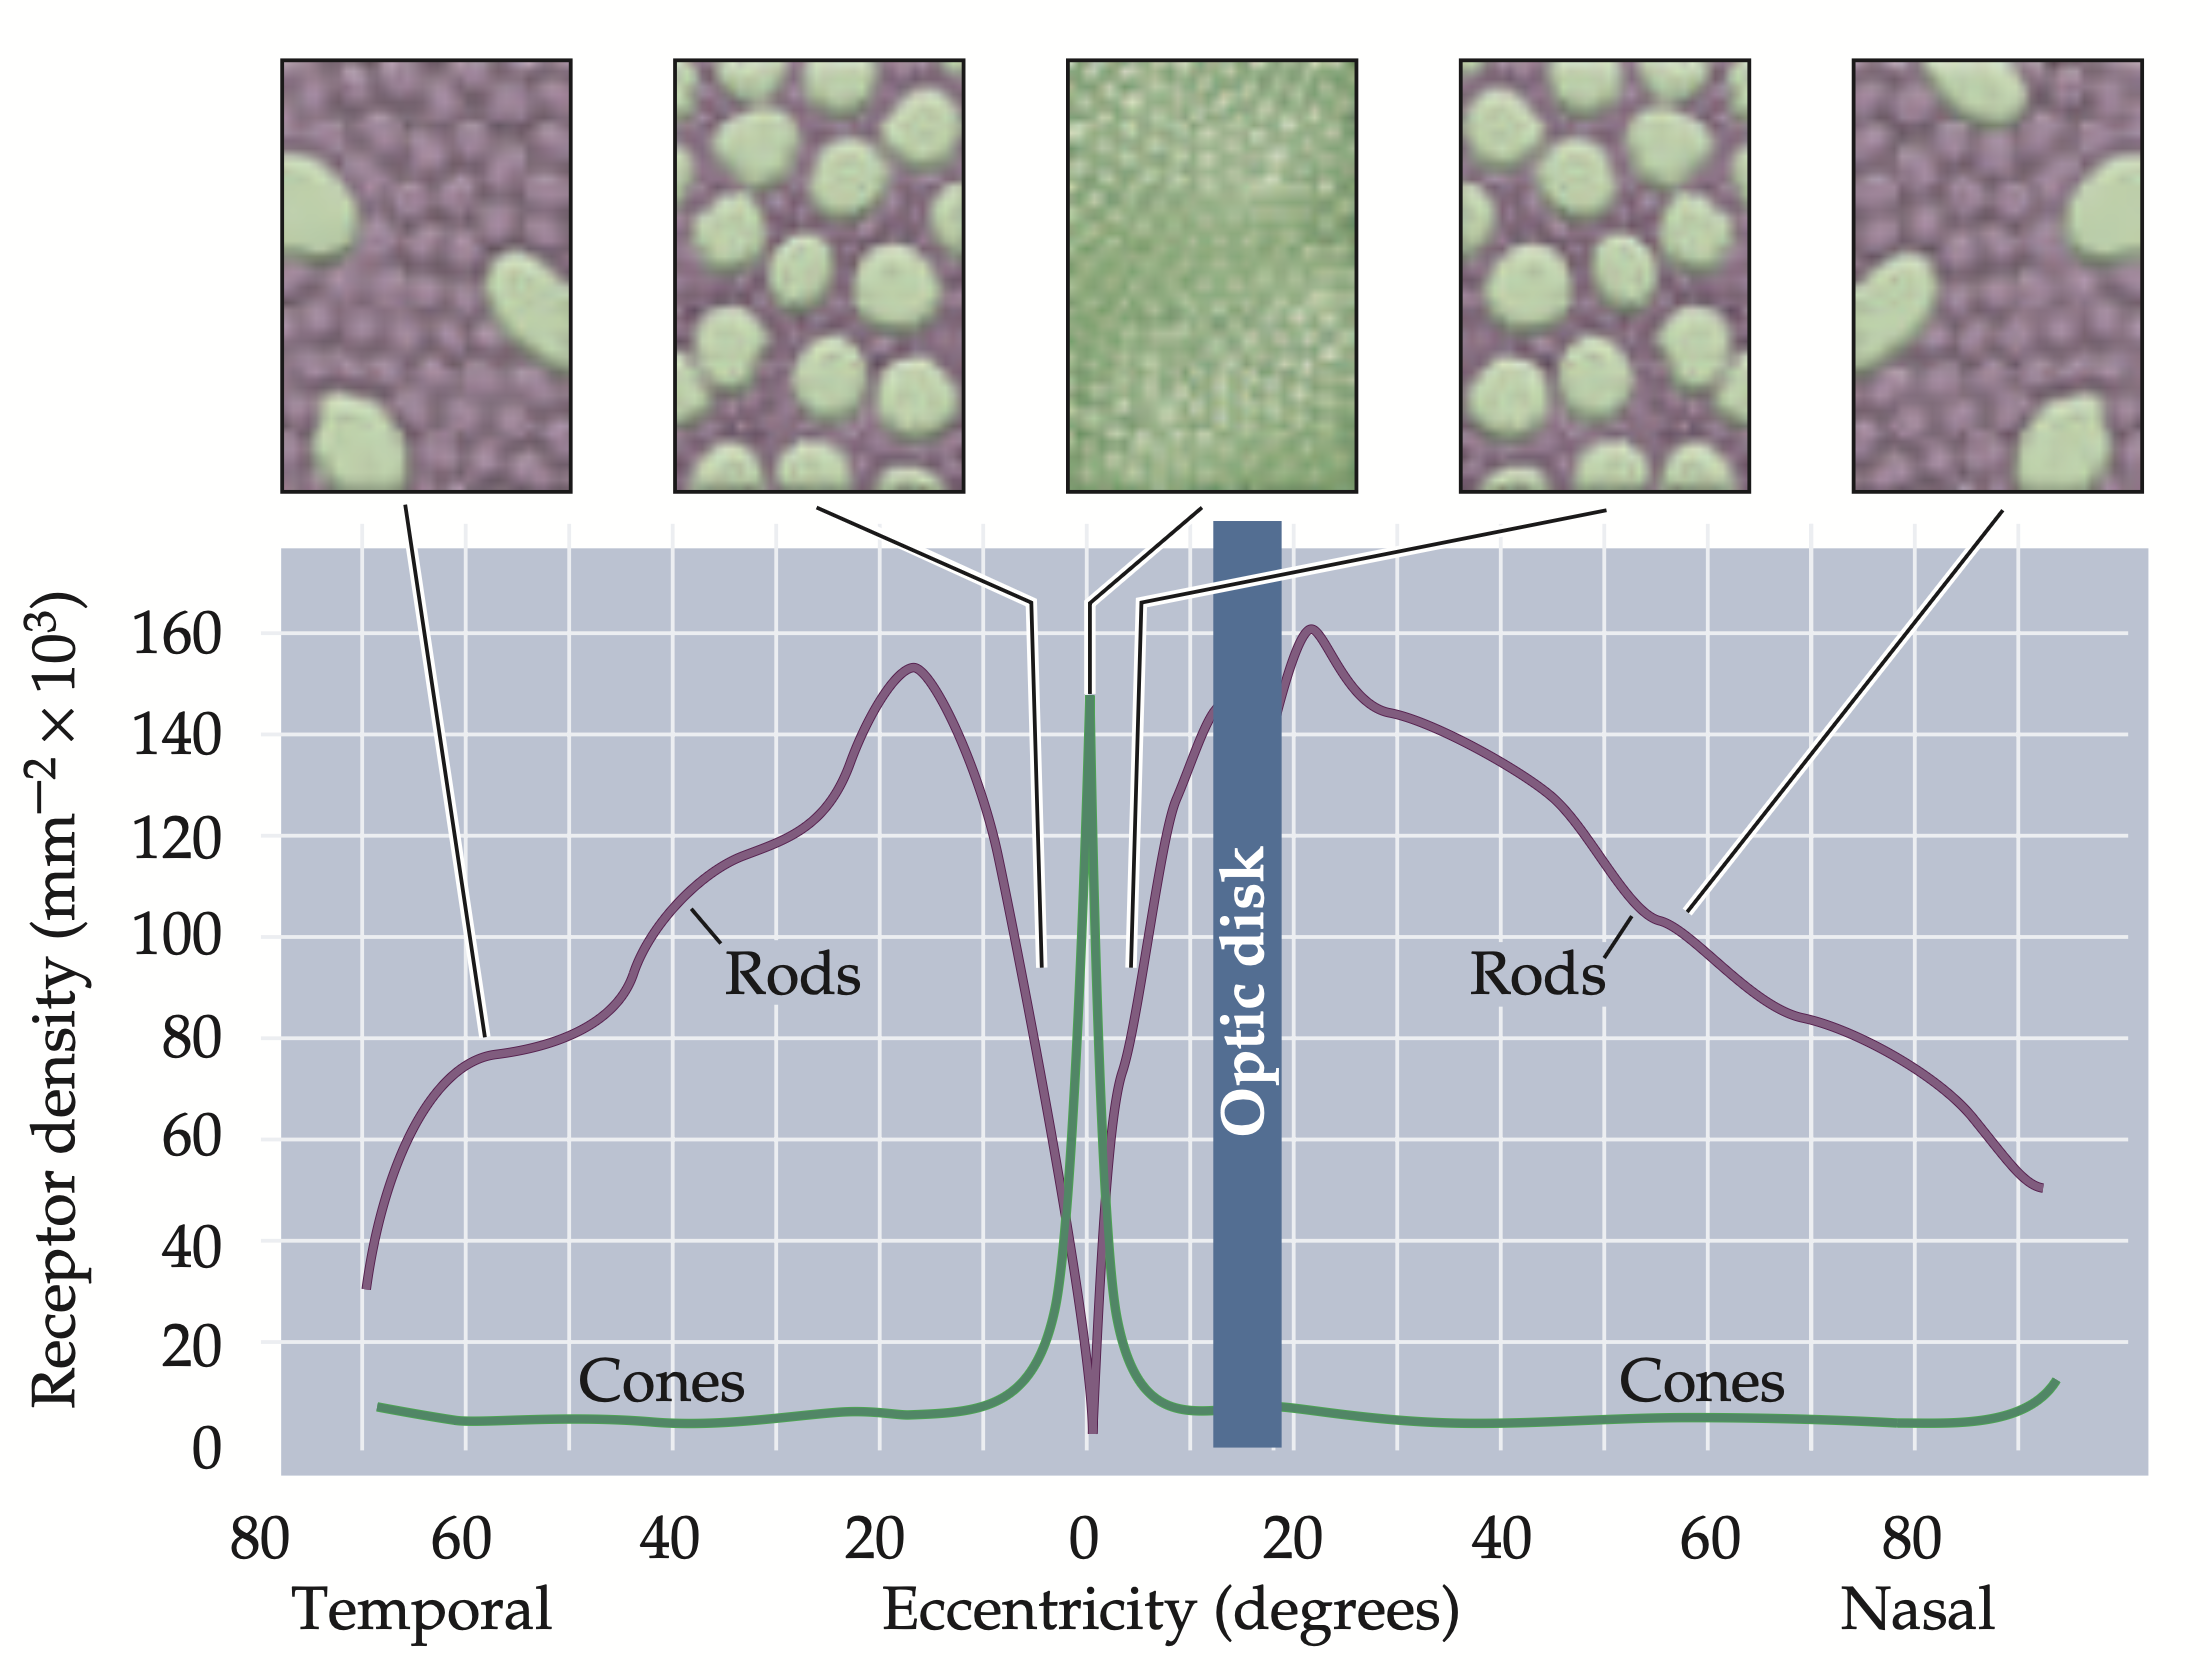
As discussed earlier, the distribution of rods and cones within the retina varies.
The fovea is densely packed with cones. The very center of the fovea (called the foveola) does not have any rods.
This leads to less perception of color in peripheral vision, although the brain is quite good at “filling in” missing information. It also leads to increased sensitivity in dark environments in peripheral vision, relative to the fovea.
Purves, D., Augustine, G. J., Fitzpatrick, D., Hall, W. C., LaMantia, A.-S., McNamara, J. O., & Williams, S. M. (Eds.). (2004). Neuroscience (3rd ed.). Sinauer Associates. p244
Within the fovea, relative to L and M cones, S cones are sparsely distributed and fewer in number. They are entirely absent from the foveola, or the very center of our vision. Because of the way S cones are distributed, we have relatively less ability to perceive detail for blue hues.
For red and green hues, the peak sensitivity for spatial frequency is about the stroke thickness of 10pt text at average reading distance, or 8 cycles per degree. Blue peak sensitivity is only 1 cycle per degree, and sensitivity is only 1/10th of red/green.
The reduced spatial resolution and sensitivity for blue hues are part of the reason it can be so difficult to read blue text on black backgrounds, and why fine details using blue hues are more easily lost.
This representation of the cone mosaic is from a 1991 paper. It is just suggestive. It comes from combining a photograph of a primate mounting with a statistical model. The left half is more random, and the right half is more regular. Some uncertainty remains around exact distribution, so it shouldn’t be taken literally, but I think it’s a good illustration of the general idea.
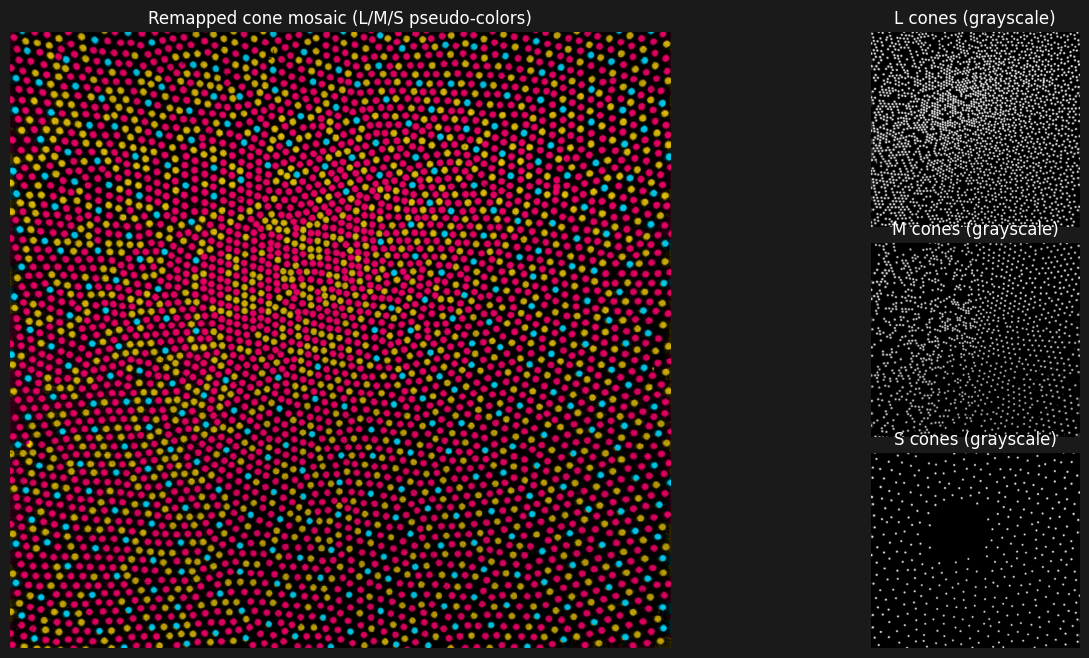
Adapted from: D.R. Williams, N. Sekiguchi, W. Haake, D. Brainard, and O. Packer, The cost of trichromacy for spatial vision, in From Pigments to Perception (A. Valberg and B.B. Lee, Eds.), Plenum Press, New York 11–22 (1991).
Anomalous Color Vision
While the cones in most people’s eyes are fairly consistent in the way they respond to a particular wavelength, about 4% of the population have variation in response for one or more cone types, or have fewer than three cone types.
This is often called “color blindness,” though the term is misleading since it suggests the complete absence of color perception. While complete absence of color perception can happen, it is incredibly rare. The most common perception difference is difficulty distinguishing red/green due to differences in L and M cone function.
This is mostly an inherited X-linked trait. Speaking loosely, it affects about 8% of men and 0.5% of women. To be more precise, people with XX chromosomes are less likely to express this trait than those with XY, as a second X chromosome acts as a “backup copy.”
The Neural Tissue of the Retina
Here is a closer diagram of the neural tissue, a lattice of many kinds of cells that perform important functions to produce the perception of color. Light travels through these layers (upward in this diagram) to eventually strike the rods and cones.
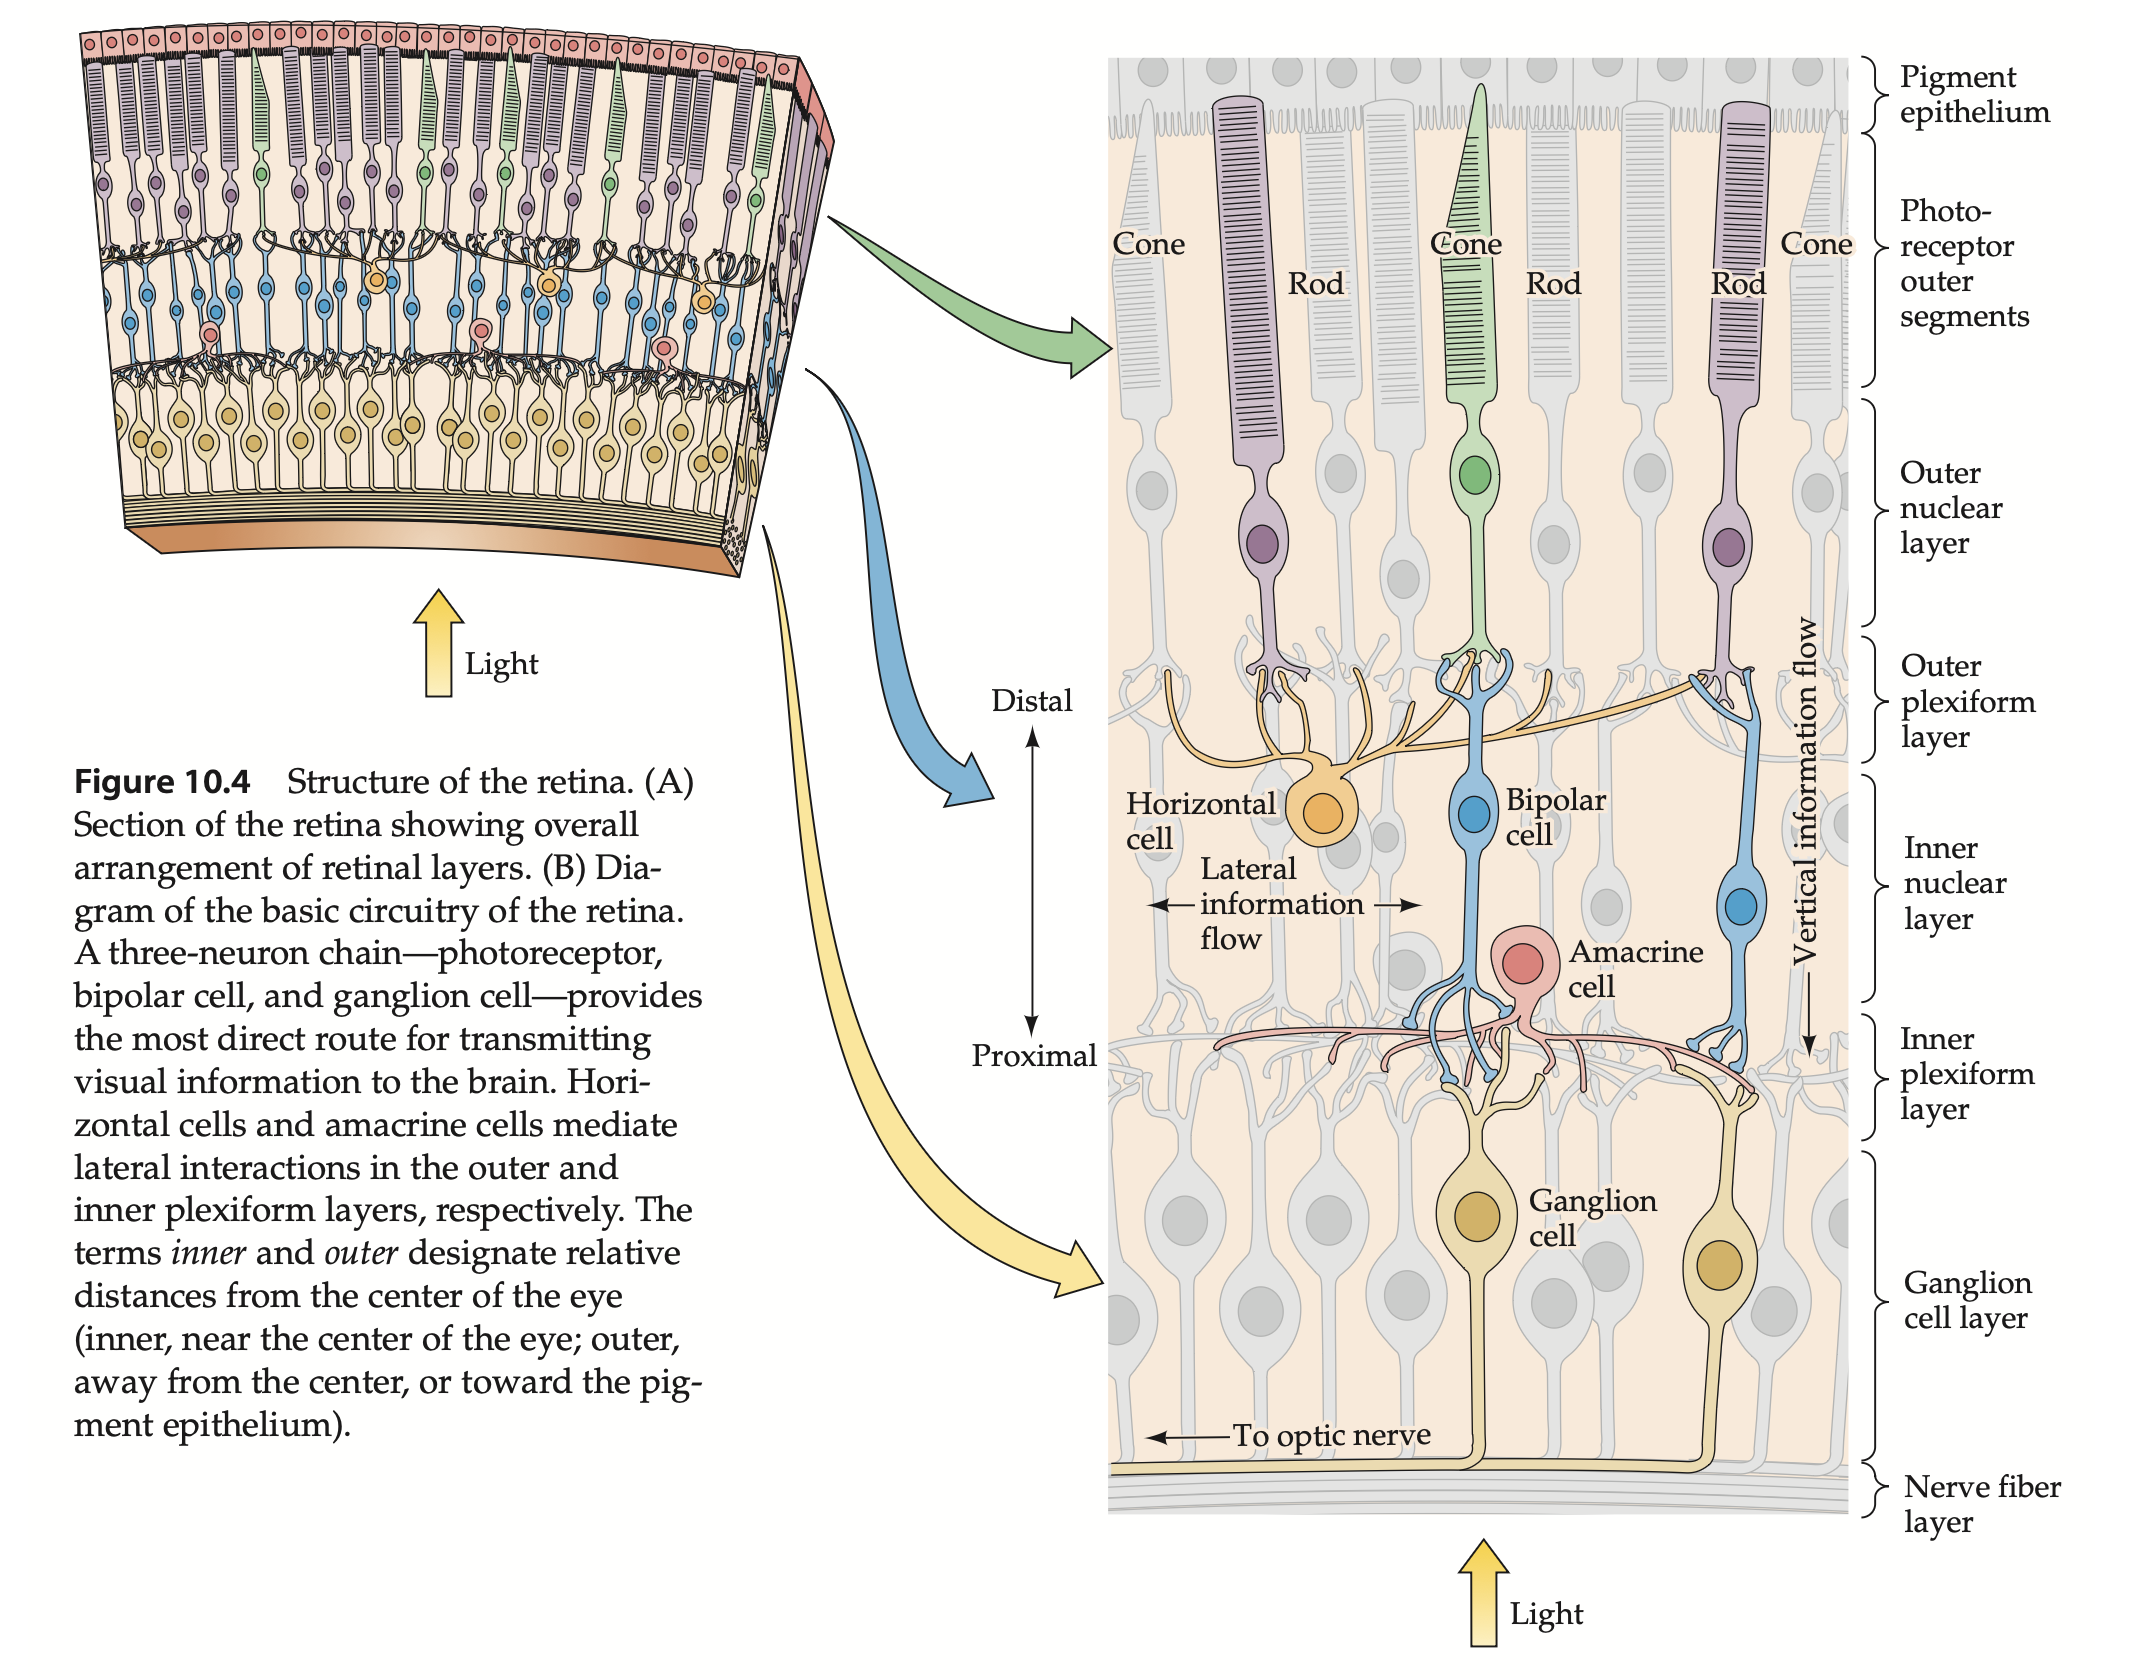
Purves, D., Augustine, G. J., Fitzpatrick, D., Hall, W. C., LaMantia, A.-S., McNamara, J. O., & Williams, S. M. (Eds.). (2004). Neuroscience (3rd ed.). Sinauer Associates. p235
As far as I know, the specific processing in each cell type is yet to be completely understood. But we do know that the signals sent from the ganglion cells to the brain are not simple point-wise representations of cones/rods.
The retina itself should be thought of as neural tissue. It does significant signal processing, reducing about 130 million photoreceptors to 1 million ganglion cells.
Neighboring L, M, S cones and rods are interconnected and compared to each other, and the signal is encoded as a series of pulses.
Opponent color channels
This image shows a rough concept of how the neural tissue combines the signal produced by cones. The L and M cones are compared with each other directly. S cones are compared with a combination of the L and M cones. This produces signals like “brightness”, “R/G ratio”, and “B/Y ratio”. These are often called “opponent color channels.”

Cones are compared in a “receptive field” where a positive response of a cone is compared with a negative response of another type of cone. In other words, the neural tissue is producing a signal based on contrast between cones. The “Y” in this diagram is the combination of L and M cones. While L and M cones are compared against each other directly, S cones are compared with the combination of L and M cones.
Some of these fields are reactive to the central cone being more stimulated than the surrounding cones. Other fields respond to the surrounding cones being more stimulated.

Human Vision is Contrast-Based
Visual perception is primarily driven by contrast of neighboring receptors.
If you’re familiar with digital image processing, the scheme is very similar to a convolutional kernel designed for edge detection.
This “edge detection” or “contrast detection” is combined with constant small movements in the eye. This includes a high-frequency tremor. This constant motion is necessary for our contrast-based vision system to work – when natural eye movements are suppressed experimentally, vision fades within seconds.
A key takeaway from this is that the way an object appears has a lot to do with the context in which it is observed. Human vision cannot be trusted to evaluate color in “absolutes” – like judging a shade of red from another when they aren’t side by side.

In this first image, we see a train that appears to be cyan. The RGB value in this image is actually slightly red!
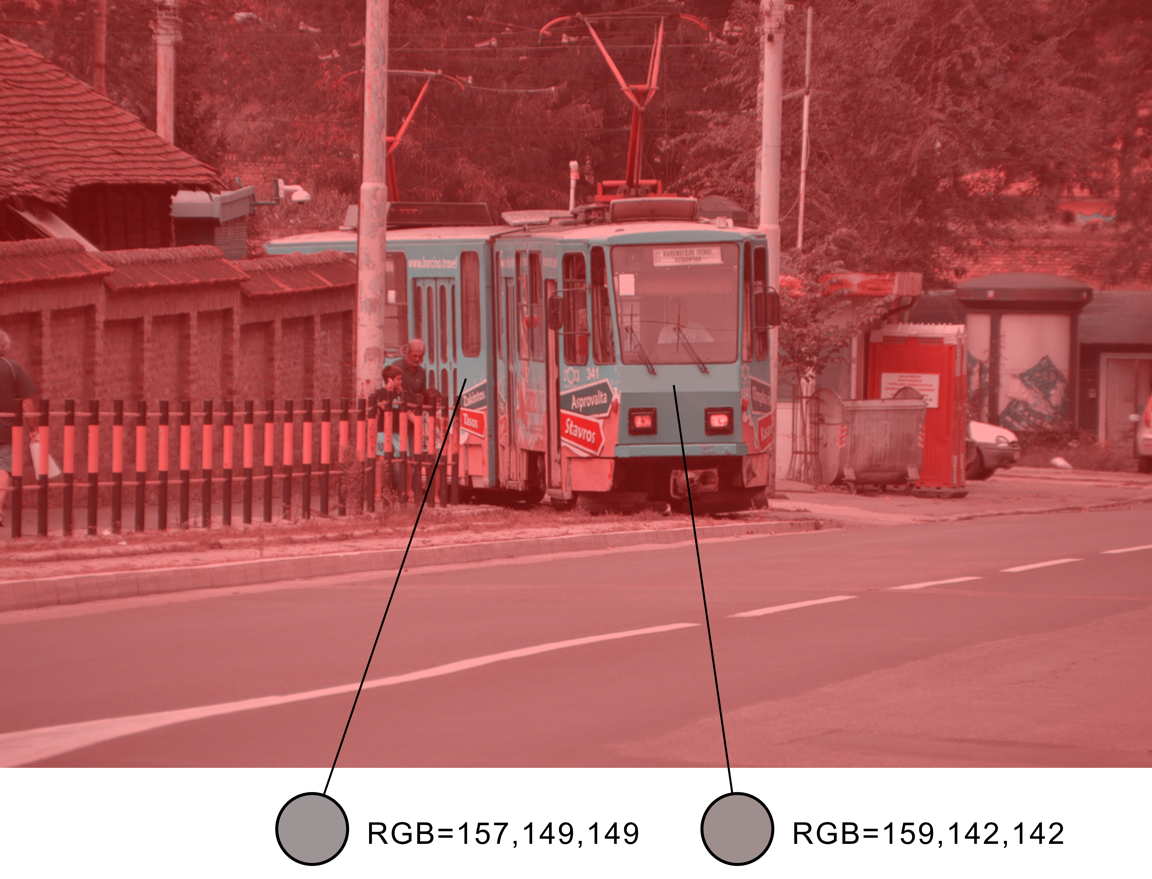
Akiyoshi Kitaoka, Ritsumeikan University, Osaka, Japan. https://www.psy.ritsumei.ac.jp/akitaoka/serbia2019.html
In this image here, the veins appear to be blue, but if you look at the RGB value, you’ll see that the veins are slightly red. Just a lot less red than their surroundings.
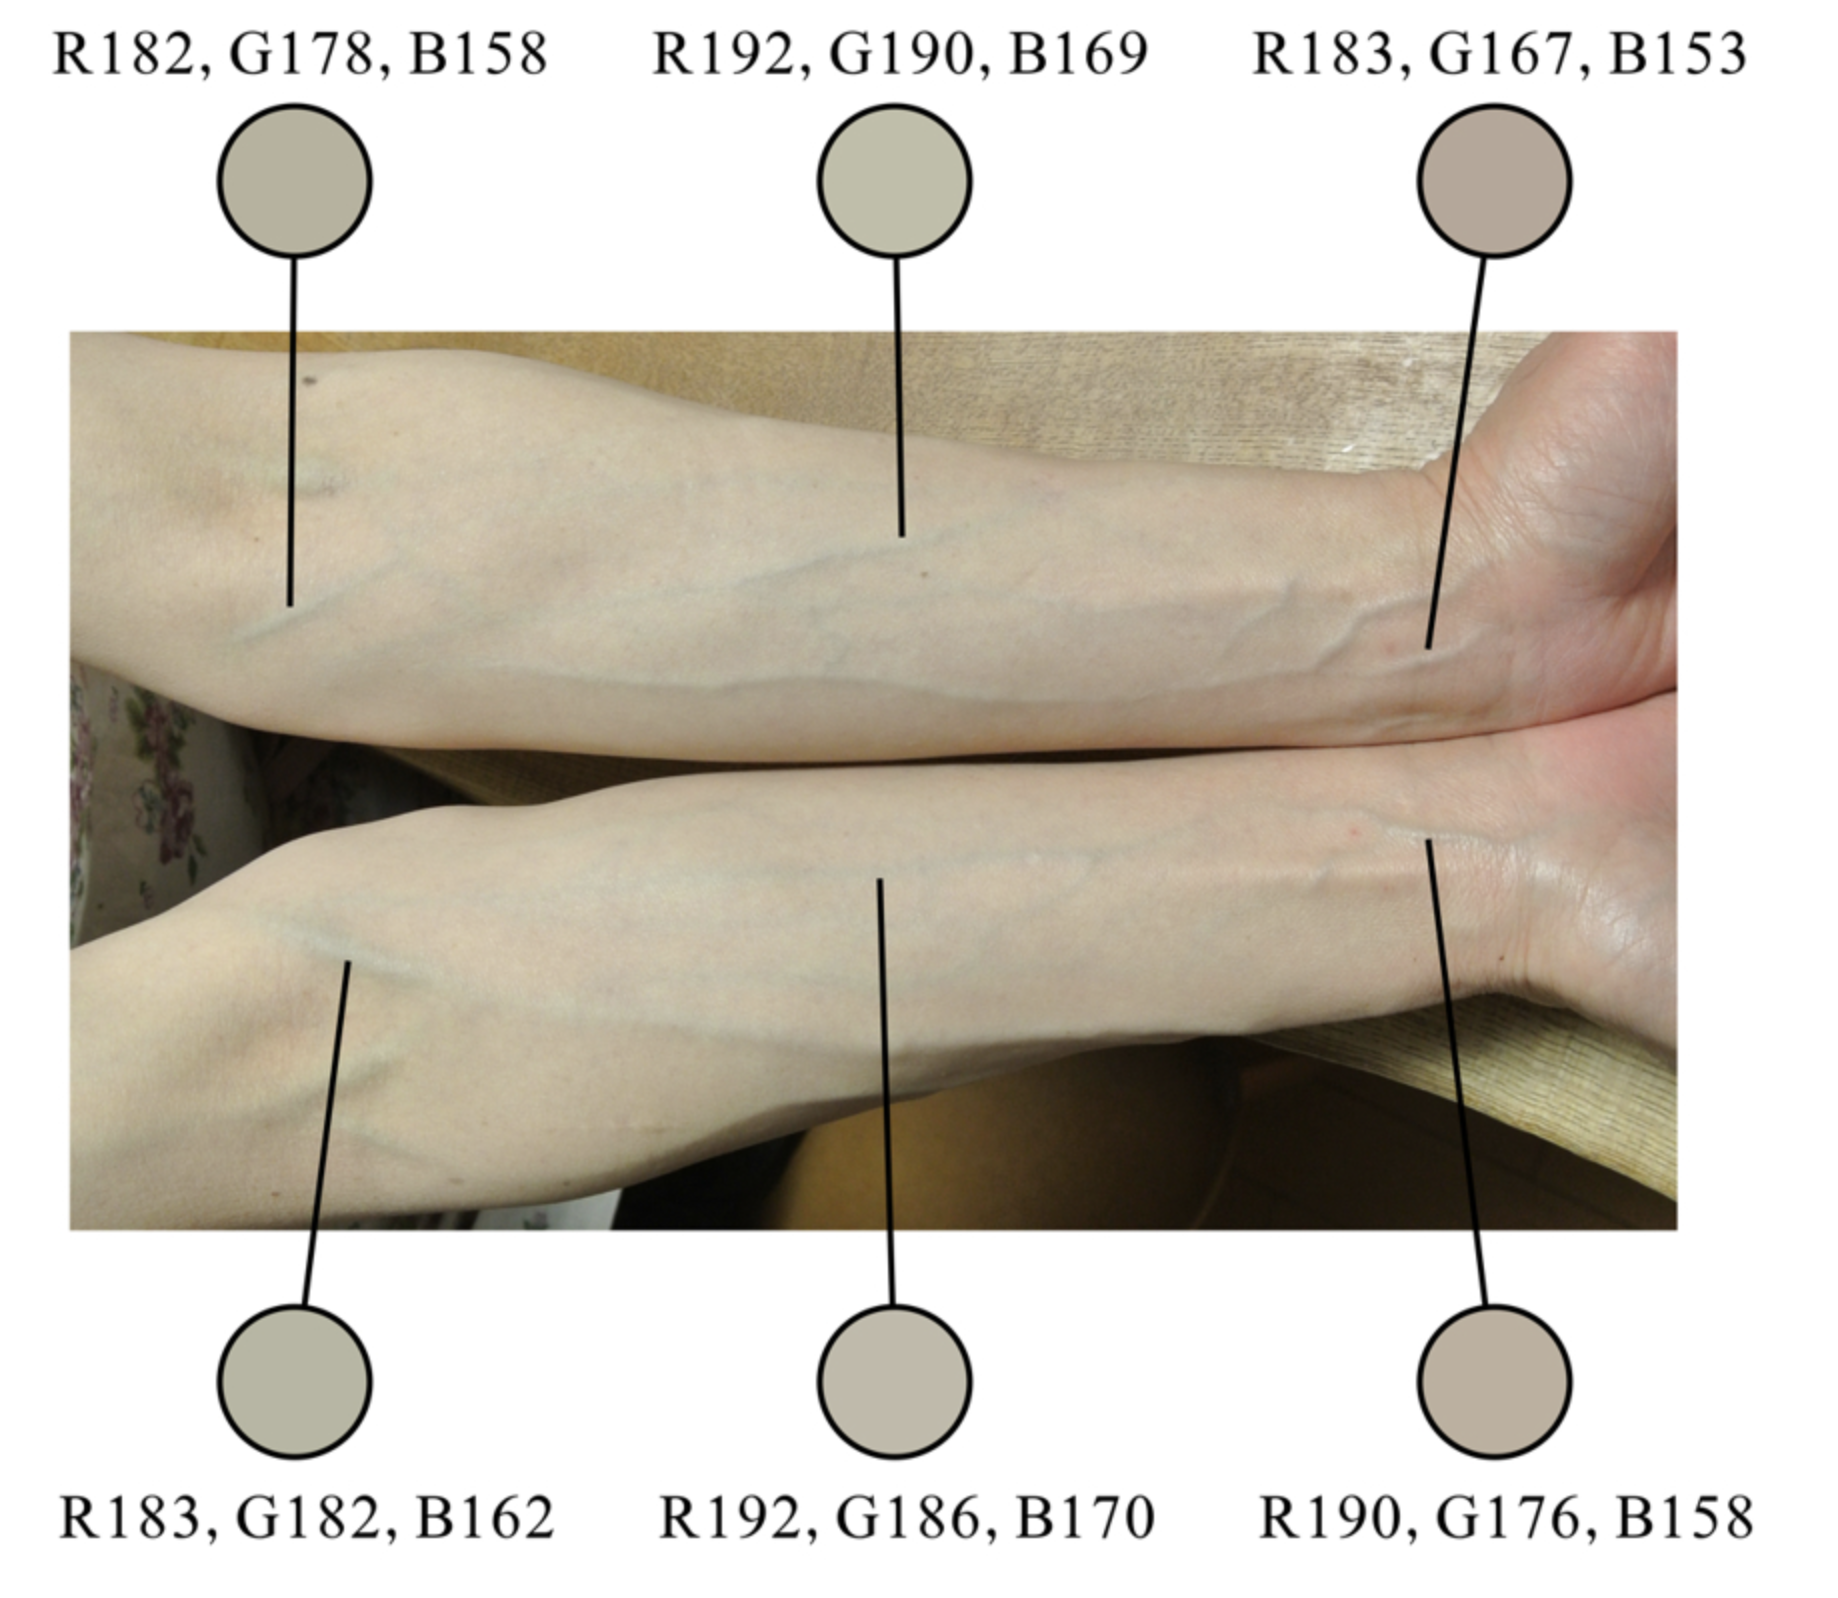
Akiyoshi Kitaoka, Ritsumeikan University, Osaka, Japan. https://www.psy.ritsumei.ac.jp/akitaoka/serbia2019.html
How to make things look “Punchy”
I hope it’s clear at this point that our eyes aren’t very trustworthy for judging color in absolute terms. The context that a color sits within matters a lot!
Take a look at a trailer for a video game or movie that feels saturated and punchy. I think good trailers going for this look maximize the perception of color through careful inclusion and exclusion of colors. Both to maximize contrast within a shot, as well as sequencing the shots to ensure contrast between each shot.
There’s also an interesting tension between contrast and readability of an image. People generally like high-contrast, saturated images. In linear media where the director chooses exactly what they want you to look at, they can maximize the contrast around those parts of the image while minimizing contrast in other parts of the image. They could accomplish this by controlling what is and isn’t in focus, or applying color grades that maximize contrast for certain ranges of tones, even if it means crushing other parts of the image, like shadows.
But in interactive media where the player is choosing what is most important to look at – perhaps trying to pick out an enemy hiding in the shadows – we might have to be more conservative, spreading our tones more evenly to maintain readability, even if it means we can’t achieve the same amount of contrast.
Chromatic Adaptation
In addition to being contrast-based, human vision is highly relative.
I took an indoor and outdoor photo of the same piece of paper. In person, they both appeared white to me. But you can see that my camera recorded an obvious change in appearance.
“White” is not an absolute physical property. “White” is whatever your visual system has adapted to as the neutral reference.

Photo of white sheet of printer paper in indoor and outdoor lighting.
Often in film, color checkers like these are used. Placing them physically in the scene allows video editing software to “normalize” the image for different lighting conditions.
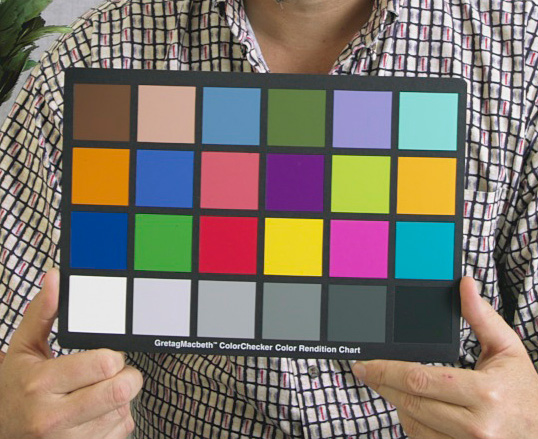
Wikipedia, placed in Public Domain by Richard F. Lyon
Here we have the same color checker placed under different illuminants.
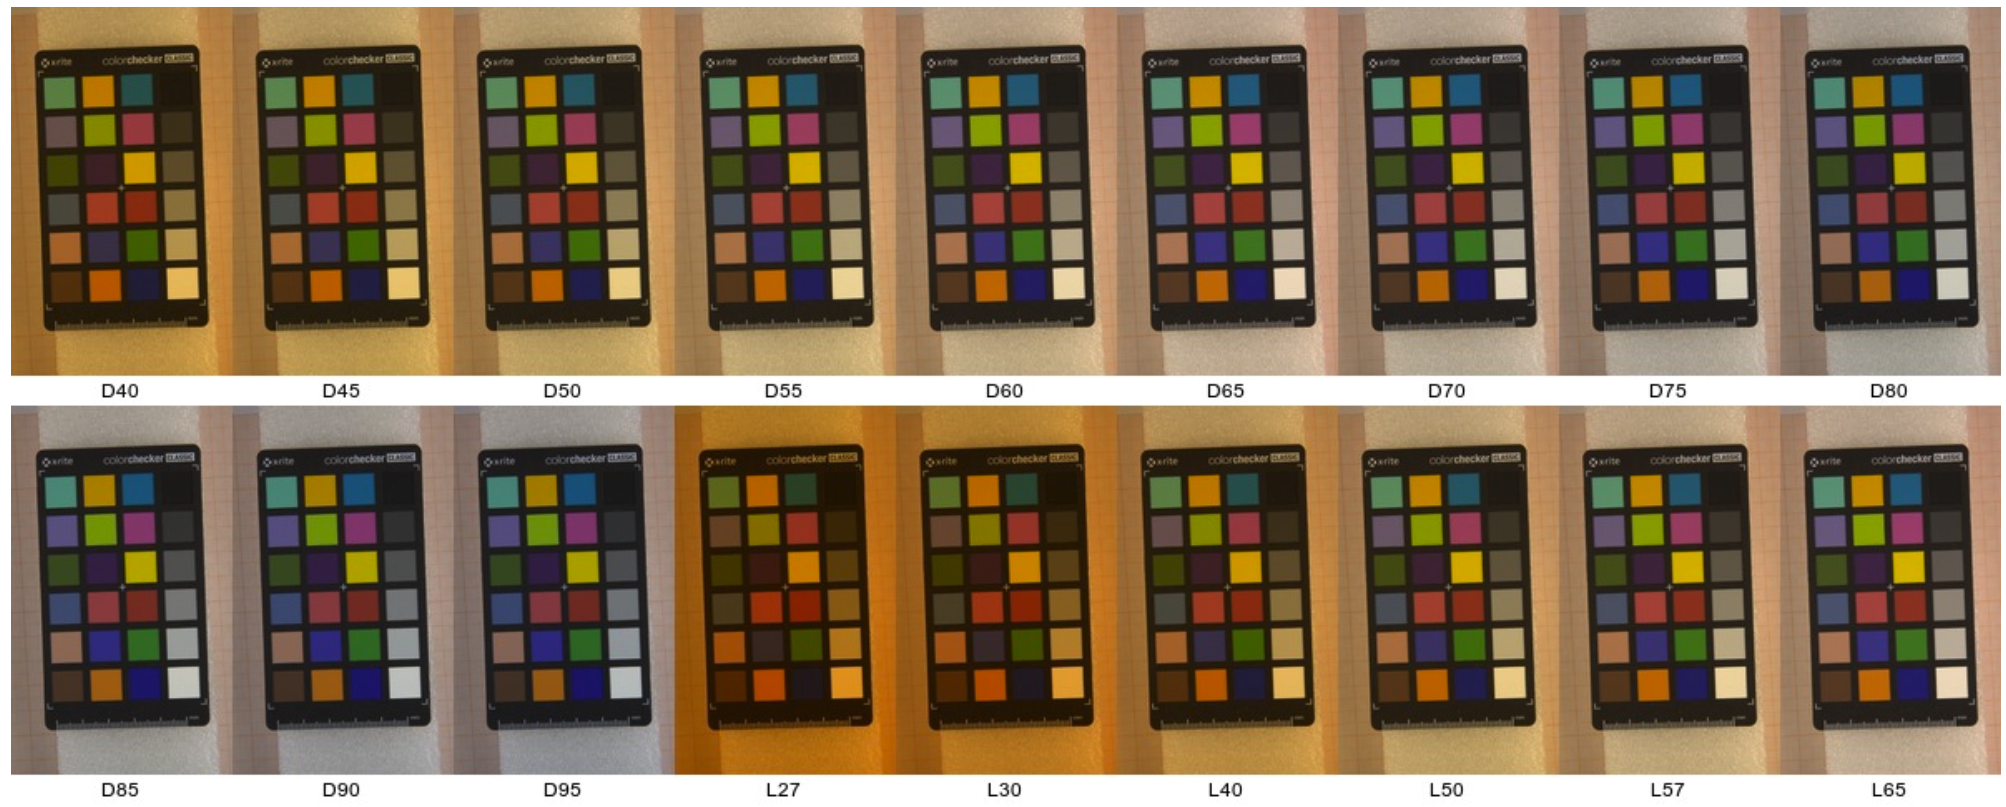
Image: Bianco, S.; Cusano, C.; Napoletano, P.; Schettini, R. Improving CNN-Based Texture Classification by Color Balancing. J. Imaging 2017, 3, 33. https://doi.org/10.3390/jimaging3030033
Any time we talk about reproducing colors, we need a reference point for white. Different white points correspond to different lighting conditions. We’ll return to this later when we discuss color spaces and rendering.
Spectrum
Now remember that earlier, I suggested to think of light as photons with some wavelength. Also recall that what we perceive as “white” light is a combination of many photons of different wavelengths.
Here I have plots of three different light sources. You can think of this as a histogram of light at various wavelengths. The x axis is the wavelength, and the y axis is the ratio of that wavelength compared to other wavelengths. You could think of it as number of photons, although really it’s the sum of energy at a wavelength rather than an actual count of photons.
Single-wavelength emission is rarely observed in nature day-to-day, although some artificial sources like lasers can produce near-monochromatic light. Most natural light sources are emitting photons of many wavelengths. The spectrum on the left is called “D65” and is meant to approximate natural daylight. The spectrum in the middle, called illuminant “A”, is modeled after older incandescent lights. The plot on the right is what we’d expect from a laser.

Surfaces can reflect or absorb light, selectively based on the wavelength. In games, this is essentially what we would call the albedo of the surface. Although here we will specify the albedo with a full spectrum, not with a 3-channel “RGB” approximation.
This reflectance spectrum comes from a dataset for the color checker we saw earlier. This is meant to be the “foliage” square, which we’d perceive as being “green-ish”. Notice how it generally reflects some light of every hue. Roughly, it only reflects 13% of the light that hits it. But there is a clear bias towards greens, which reflect more than 13% of the incoming light.
To be clear – this is just diffuse reflection, where light “enters” the object and bounces out of it. Specular reflection would mean the light bounces off of the object without penetrating it – kind of like skipping a rock on the surface of a pond. This gets into physically based rendering, which is too big of a subject to cover properly here. One way to think about this is that we are looking at the object “straight-on” instead of at a glancing angle. For example, imagine standing on the surface and looking straight down. The only kind of reflection we will deal with today is diffuse reflection.

You may notice that the swatch in this plot doesn’t match the darkness of the foliage square on a typical color checker photograph. This color only represents the chromaticity… or the color if we ignore “brightness.” Here is a plot of different colors at this chromaticity. This is a bit like choosing the exposure of our camera. It’s easier to see the color at higher brightness, so I’ll use higher exposure for the following examples.

Now, we will combine the D65 illuminant with the foliage material. We just multiply.
Notice how the material reflects more green than blue, despite the illuminant being slightly biased towards blue.

So now we have this new spectrum that represents the light after it has entered, then exited, the material. We combined relatively white light with a relatively green surface, and so it makes sense that we still have a bias towards green in this spectrum.
Now, let’s see how that light interacts with the cones in our eyes.

We’ll do the same thing, multiplying the incoming light spectrum with the relative sensitivity of the three cone types in the retina. Remember, this represents millions of photons of various wavelengths hitting the retina, and these curves are distributions of how likely a photon is to be a certain wavelength, or how likely a cone is to respond to a photon of a certain wavelength.
Multiplying, and then taking the area under the curve tells us how strongly the cone types will be responding.

And this final ratio is ultimately what drives our perception of one color vs. another.
We could change our illuminant – for example, swapping “D65” for “A” to predict what this material would look like indoors with very warm lighting. The two illuminants are pretty different, so it shouldn’t be surprising that the resulting color is also different. The “A” illuminant is very warm, and produces more photons of long wavelengths in the visible range than D65.

We could also keep the same illuminant but change the reflectance spectrum and get a different final color.
When you see something that is “green” – it almost certainly does not mean that your eye is only detecting photons of a green-ish wavelength. Instead, it means that the distribution of wavelengths of photons hitting your retina are exciting your M cones more than the L and S cones.
For non-emitting surfaces, the spectrum distribution of photons entering the eye is a combination of the spectrum distribution of the illuminant that is lighting a surface, and the way that surface selectively absorbs or reflects photons of different wavelengths. (Again, we’re only dealing with diffuse reflection, and diffuse materials. No specular reflection!)
What this means, is that the perceived color of an object depends on both the material, and the light.
Metamers
Human vision is lossy – multiple spectra, even those that are wildly different from each other, can stimulate cones in the same way – the histogram of wavelengths in observed light are being compressed to three values: “brightness”, “R/G ratio”, and “B/Y ratio”.
This is a simulated example of two different illuminants, being applied to two similar diffuse materials. R1 is the same measured data as before from a “foliage” patch of a color checker. R2 is a fictional surface that is similar, but not exactly the same, as R1. The reflectance spectra for both materials are plotted in the bottom left.
The two illuminants I am using are the same “D65” and “A” as we saw before. The D65 illuminant is meant to simulate a sunny afternoon outside. The “A” illuminant is a particularly warm artificial light. The illuminant spectra are plotted on the bottom right.
R2 has been chosen such that if this fictional material was viewed in daylight next to the original material, they would appear the same. But if they were both taken indoors, they would no longer match. (Assuming the indoor light is somewhat close to the “A” illuminant.)

Displays
Now we know that different spectra of light can produce the same color sensation. How is that helpful?
Display technology that we use every day relies on this phenomenon. They mix three primary colors to form an image. Here is the spectral distribution for an Apple Studio Display. (I picked it because the python colour-science library happens to have this dataset.)
- You’ll notice sharp R, G, and B peaks. Using a combination of these spectra, the LCD monitor can excite the cones in your eyes in such a way to produce a wide range of colors
- Even though there is a dominant wavelength, particularly for R and G in this diagram, the wavelengths produced by the display are still a distribution of wavelengths, rather than photons of a single wavelength.
- There is nothing special about the spectrum here. Different displays will produce different spectra, and I expect there would even be variance from unit to unit. Display manufacturers must calibrate displays so that combinations of the three spectra they emit produce the colors we expect to see.
We often take it for granted that this works to reproduce so many different color sensations! Next time, we will dive into colorimetry – or the process of measuring color. And we’ll learn why displays with spectra like this are able to produce such a wide range of color.

References
- Fairchild, Mark D. (2013). Color Appearance Models. Wiley-IS&T Series in Imaging Science and Technology (3 ed.). Hoboken: John Wiley & Sons.
- Jackson, R., MacDonald, L., Freeman, K. Computer generated color: a practical guide to presentation and display. (1994). John Wiley & Sons, Inc.
- Purves, D., Augustine, G. J., Fitzpatrick, D., Hall, W. C., LaMantia, A.-S., McNamara, J. O., & Williams, S. M. (Eds.). (2004). Neuroscience (3rd ed.). Sinauer Associates.
Image Credits
- Anatomical diagrams: Hussey, K. A., Hadyniak, S. E., Johnston, R. J. (2022) Patterning and Development of Photoreceptors in the Human Retina. Frontiers in Cell and Developmental Biology. Volume 10 - 2022. https://www.frontiersin.org/journals/cell-and-developmental-biology/articles/10.3389/fcell.2022.878350/full. (CC BY)
- Illustrations of train/arms: Akiyoshi KITAOKA, Ritsumeikan University, Osaka, Japan https://www.psy.ritsumei.ac.jp/akitaoka/serbia2019.html
- Photo of color checker: placed in Public Domain by Richard F. Lyon
- Illustration of color checker under different illuminants: Bianco, S., Cusano, C., Napoletano, P., Schettini, R. Improving CNN-Based Texture Classification by Color Balancing. J. Imaging 2017, 3, 33. https://doi.org/10.3390/jimaging3030033
Datasets for illuminants and materials come from colour-science python library